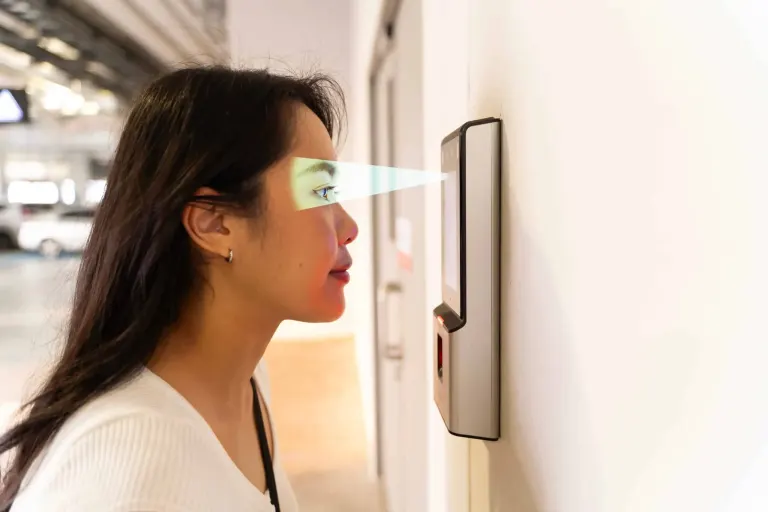
Every face recognition vendor claims high accuracy. Some cite independent evaluations by the US National Institute of Standards and Technology, which is the closest thing the industry has to a neutral referee. But NIST results are easy to quote selectively, and a buyer who does not know how the evaluations are structured cannot tell a meaningful claim from a technically-true-but-irrelevant one.
This guide explains what NIST actually measures, how to read a ranking claim, and what any of it means for whether your employees can clock in reliably on a cold morning.
What NIST evaluations are
NIST runs ongoing evaluations of face recognition algorithms submitted voluntarily by developers, testing them on large sealed datasets under controlled conditions. Developers cannot tune to the test data, results are published, and the same protocol is applied to everyone. That combination — independent, standardised, published — is what makes the programme valuable.
Importantly, NIST tests algorithms, not products. A vendor’s attendance app is not evaluated; the recognition engine inside it may be. That distinction is where most misleading claims live.
The two tasks, and why the difference matters
1:1 verification
Given a face and a claimed identity, is this the same person? This is the task most attendance systems actually perform when an employee identifies themselves — by badge, PIN or selecting their name — and the system confirms it.
1:N identification
Given a face, find it in a database of N people. This is what happens when an employee simply walks up and the system works out who they are without being told. It is harder, and it gets harder as N grows: a gallery of 50 employees is a very different problem from 50,000.
When a vendor cites a NIST ranking, ask which task, and at what gallery size. An algorithm that excels at 1:1 verification may sit mid-table at large-scale 1:N. For attendance, most deployments want good 1:N performance at a gallery size matching their headcount, because walk-up-and-go is the whole appeal.
Reading the error rates
- FNMR / FRR — false non-match, or false rejection. A genuine employee is not recognised. This is the error your workforce experiences, and the one that generates paper override sheets.
- FMR / FAR — false match, or false acceptance. Someone is recognised as a different person. This is the error your auditor cares about.
The two trade off against each other along a threshold you can move. Any accuracy figure quoted without its counterpart is incomplete: “99.9% accurate” tells you nothing unless you know at what false-match rate, on which dataset, at what gallery size.
The standard way to compare is false non-match rate at a fixed false match rate — for example, FNMR at FMR of one in a million. That formulation lets you compare algorithms on equal terms, and it is the shape of claim worth taking seriously.
Demographic differentials
NIST has published extensive work on how error rates vary across demographic groups, and the findings are consequential: differentials exist, they vary enormously between algorithms, and the best-performing algorithms show markedly smaller gaps than weaker ones.
For an employer this is not an abstract fairness question. If your system fails more often for some employees than others, those people queue longer, get flagged more often, and experience the system as unfair — because it is. Ask specifically whether the algorithm has been evaluated for demographic differentials and how it performed. It belongs in your impact assessment; see our compliance hub.
Five ways NIST claims get spun
- Citing a rank without the category. Evaluations have many sub-tracks and datasets. “Top ranked” is meaningless without which one.
- Quoting an old submission. Results are continuously updated. A ranking from several years ago may not reflect the current algorithm, or the current field.
- Citing the SDK developer, not the product. A vendor licensing a third-party engine may cite that engine’s results while shipping an older version, or a different configuration.
- Using 1:1 numbers for a 1:N product. Technically accurate, practically misleading.
- Ignoring the operating threshold. Real deployments run at a configured threshold that may be far from the one producing the quoted figure.
What NIST does not tell you
Laboratory accuracy is a necessary condition, not a sufficient one. It does not tell you how the system behaves with a cheap tablet camera in a dim corridor, with hard hats and safety glasses, with a worker whose hands are wet, or when a hundred people arrive at once. Nor does it evaluate anti-spoofing — that is a separate discipline with its own standard, covered in our guide to ISO 30107-3.
Treat NIST results as a filter rather than a decision. Strong independent results mean the engine is credible; your pilot determines whether the product works in your conditions.
How to use this in a purchase
- Ask who developed the recognition algorithm and whether it has been independently evaluated.
- Ask for the specific evaluation track, dataset and date — not a marketing claim.
- Ask for FNMR at a stated FMR, at a gallery size like yours.
- Ask about demographic differential performance.
- Then pilot on your own devices, in your worst location, at your busiest moment.
Our RFP checklist covers these alongside the operational questions, and why NCheck explains the provenance of the engines behind our own products.
Frequently asked questions
Is NIST participation mandatory?
No, it is voluntary. A developer who does not participate is not necessarily poor — but you then have no independent evidence, and should weight your own pilot accordingly.
What accuracy is good enough for attendance?
Modern leading algorithms are far beyond the practical requirement for attendance at typical company gallery sizes. Your failure risk is environmental — lighting, angle, coverings — not algorithmic.
Do fingerprint and iris have equivalent evaluations?
Yes, NIST runs evaluations for other modalities too. Ask for the relevant one if fingerprint or iris is central to your deployment.
Does a better algorithm reduce spoofing risk?
No. Recognition accuracy and presentation attack detection are separate capabilities. Evaluate both.
Why laboratory accuracy and field accuracy diverge
An algorithm that performs superbly in evaluation can still produce daily failures in your building, because the evaluation controls for variables your site does not.
Capture quality. Evaluations use reasonable-quality images. A five-year-old tablet with a scratched lens in a dim corridor is a different input entirely. The algorithm is not the limiting factor here; the camera and the lighting are.
Pose and distance. People walking past at an angle, looking at their phone, or standing too close, all degrade recognition. Mounting height and position matter more than most deployments allow for — a device at chest height for a tall worker is at eye level for a shorter one.
Occlusion. Hard hats, safety glasses, masks and high-visibility hoods change what the camera sees. If your workforce wears them, insist the pilot includes them.
Enrolment quality. A poor enrolment image caps recognition performance for that person permanently, regardless of algorithm quality. Enrol in conditions similar to where people will check in, and re-enrol anyone who fails repeatedly.
Gallery size and threshold. A system configured for a 200-person site behaves differently at 20,000. If you expect to grow substantially, ask how the threshold and performance change.
A pilot that produces a real number
To get a field accuracy figure you can defend internally, run a structured two-week pilot: enrol one full department including everyone who normally presents difficulties; use the exact devices and mounting positions you intend to deploy; record every failed recognition with the time, location and person; and count manual overrides separately.
At the end, express the result as failed recognitions per thousand check-ins, broken down by location. That single figure — measured in your conditions, not a laboratory’s — is what should drive the decision. Compare it with the same measurement for the alternative product, and the choice usually makes itself. Our RFP checklist covers how to structure the wider evaluation.
NCheck is a biometric attendance system by Neurotechnology that runs on-premises or in the cloud, supports face, fingerprint and iris recognition, and works on phones, tablets, IP cameras and biometric terminals. Free forever for up to 5 employees.